Speech at the 10th Japanese Business Leaders Conference on Environment and Development, Tokyo, 12. Nov. 2002
Introduction
I feel greatly honoured being invited as your tenth speaker in the Business Leaders Conference on Environment and Development. Nihon Keizai Shimbun started the series in the year of the Earth Summit of Rio de Janeiro, the UN Conference on Environment and Development. 1992 was the year of culmination for the topics of environment and development. Since that year, public attention worldwide has to an alarming extent deserted both topics.
I shall briefly offer some unconventional views on Japan and then move on to discuss the megatrend of globalisation which I see as the main reason for the massive neglect of the environment. I shall conclude with an attempt at establishing a new sense of direction for technology, civilisation and investments.
Is Japan ill? I rather think the opposite
So let me begin with my personal views on your country. Foreign commentators tend to depict Japan as stagnating and ill. Increasingly, even the Japanese seem to believe in this negative assessment.
Of course, in a world in which growth is the yardstick of success, you cannot be too happy. Of course, one feels worried by non-performing loans worth 40 trillian Yen and by a national debt of 400 million Yen.
And, of course, everybody right in his mind has to support your Prime Minister Jun-ichiro Koizumi’s bold reform policies including the privatization of some of the tokushu-hou-jin (Special Public Corporation). He also addresses new competitive frontiers which are to be explored chiefly by the private sector.
However, let me as a guest and an outsider say a few words of reassurance to you. I have the privilege of visiting Japan rather regularly. What I see is a strong and prospering country proud of its history, full of high technology industry, pioneering in exquisite services. I visit top class universities, see happy school children in pretty school uniforms and enjoy clean and well-functioning public transport. I feel safe in the absence of crime and violence. Best of all, the people you meet on the streets look happy and respond with exquisite politeness to any question of a foreigner. Compare Japan to the violence situation in US American cities, in Colombia or in South Africa! Compare Japan with the poverty situation in most developing countries. Compare Japanese tolerance with the religious or political intolerance and fighting in half of the countries of the world! No, I find it squarely scandalous of journalists and economic analysts to call Japan a sick country.
One of your and of PM Koizumi’s worries is the lack of economic growth. But then let us reflect for a moment. What is the meaning of zero growth in a situation of a stable population and of high prosperity? It still means a huge turn-over; it can mean an increasing stock of wealth. It only means that the flow, covering both increase and maintenance of wealth is not bigger than it was in the preceding year. As a matter of fact, private financial assets are nearly four times as high as your state deficit meaning that your country as a whole is not indebted.
There are only two worrying facts associated with zero growth. One is that some competitors may eventually outgrow you. And the other is that technological advances produce higher labour productivity, which means an increase of unemployment, a phenomenon unknown to Japan for many happy decades.
I shall address both troublesome facts later. As I said before, I am not suggesting that Japan cannot be improved. I share the view in particular that Japanese consumers would do a good thing returning to an optimistic habit of spending. But I am suggesting that all measures of improvement including the Koizumi reforms would greatly benefit if the country would enjoy a new and clear sense of direction.
A clear sense of direction means that investors know where to invest. Banks trust that the investments make sense. And consumers want to be “with it” and re-discover the joys of owning the right things.
Blind markets
Markets in our days hardly create a new sense of direction. They did so in the past when essentially all goods and services were in short supply. Industry was only too happy to produce all that was needed. During this happy period the increase of labour productivity was only too welcome. It meant that ever more could be produced and that wages could steadily rise. Japan surely had a strong state dominating the economy. But the business community didn’t mind. “Japan Incorporated” benefited all during that period.
Let me repeat and highlight one aspect of this period. It is the dominance of the state over the private sector. Fig. 1 symbolises this situation, — in a caricature fashion.
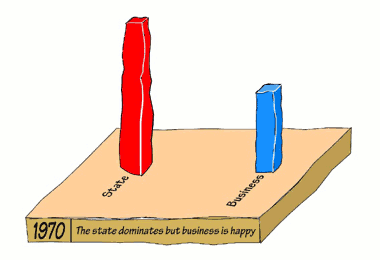
Fig. 1: The state dominates but business is happy.
What was true for Japan, could similarly be found in West Germany, in Canada and essentially in all OECD countries. In the USA, in particular, the strong leadership of the state, the serious quest for social justice and the relatively humble role of the private sector, could be observed since the days of John F. Kennedy — not to mention Franklin D. Roosevelt a generation earlier.
But then, after the turbulences of the oil crisis and in its wake the novel arrogance of Islamic fundamentalism, first culminating in the Iran hostage crisis, the USA underwent profound changes. Ronald Reagan enjoying a landslide victory in 1980 pulled out of the welfare state and in foreign policy steered the country into harsh confrontation against what he called the “evil empire”. He promised to reduce taxes for the achievers and invited private business to take its profits home. In effect you could see the state on retreat.
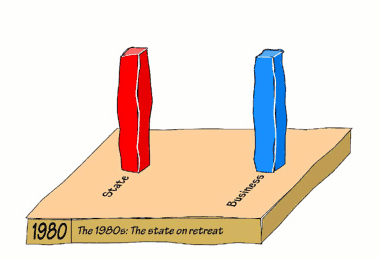
Fig. 2: The 1980s: The state on retreat.
Similar developments could be observed in Britain, Germany and several other countries. At the time, I believe, it was good for these countries that the private sector assumed additional responsibilities and introduced efficiencies unknown to some state owned agencies. But in some cases such as the privatization of the British rail it went all wrong. Anyway what I am suggesting is for each country to maintain a healthy balance between public and private.
Globalisation
In many parts of the world we seem to have lost that balance. When the Soviet bloc collapsed, many nation states in the West and in the developing world all of a sudden lost much of their bargaining position towards the international capital markets. This bargaining position had been rooted to a large extent in the very existence of the communist threat. It forced capital owners to accept progressive income taxes, social security and environmental regulation. This was simply because the socially inclusive market economy was still better for capital owners than any kind inclination of a country to go communist.
Now, after 1990, that comfortable bargaining position of the nation state was gone. What now happened, was called globalisation and was characterised by the dominance over the smaller nation states of international capital markets.
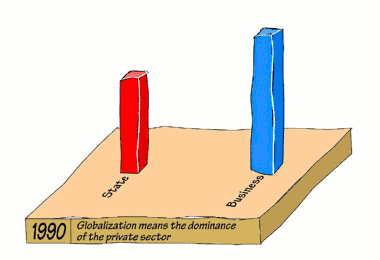
Fig. 3: Globalisation means the dominance of the private sector.
This is our situation today. First, the world (and not only business) was celebrating it. The spectre of a third world war had disappeared. . Hundreds of million of people were liberated from dull, authoritarian and inefficient regimes. Huge peace dividends were expected to arrive. The stock markets soared. Francis Fukuyama in America called it the end of history, i.e. the end of ideological quarrels. Markets were believed to give guidance towards ever increasing prosperity. Nobody dared to question whether we had a reliable sense of direction.
Nobody dared to raise doubts about the legitimacy of the dominance of the private sector because the dominance of the state had conspicuously lost its legitimacy.
However, the euphoria didn’t last very long. Soon people began to realise that the gap between the rich and the poor was steadily widening. The income gap between the richest and the poorest twenty percent of the world population rose to a shocking factor of 75 during the 1990’s.
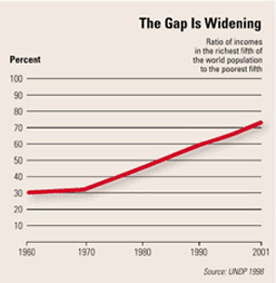
Fig. 4: The widening gap of income world wide.
Environmental policy became a nightmarish task because everybody’s immediate concern was now to survive in the unforgiving struggles of globalisation.
Even in their home turf, financial markets performed a lot poorer than expected In rapid succession, currencies from Eastern Europe, Western Europe, Mexico, the Asian emerging markets, Turkey and Argentina were subject to extremely damaging turbulences. Worst of all, the “new economy bubble” imploded and with it the entire euphoria of the global stock market.
The states, guardians of the public goods, suffered from stagnating revenues, in part self-inflicted through a rat-race for ever decreasing corporate taxation.
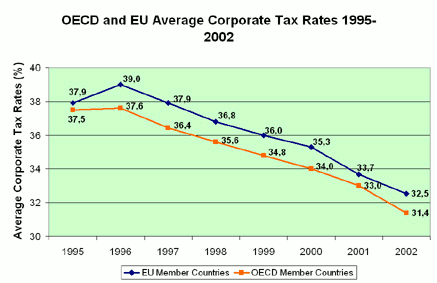
Fig. 5: Diminishing corporate tax rates in OECD and EU member states.
Ordinary people got increasingly worried and angry about the arrogance of the dominant market ideology. In Seattle, Gothenburg, Genoa you could see them marching and protesting. Protesters mostly represented the losers of globalisation. They also represented in a great variety of ways public goods such as the environment, human rights, social equity, farmers rights, cultural diversity, or the rights of indigenous people. You can ask any of these people if they see a purely monetarised globalisation as damaging to the public goods they defend. And their answer will clearly be “YES”.

Fig. 6: ¥€$.
Let us take stock for a moment. The victory of what we all considered the superior systems namely the democracy-based market economy, appears to be in the doldrums. People worldwide seek for a sense of direction, but in vain. Except, perhaps in China and America. In China they still enjoy the clear sense of direction of just increasing economic output. And in the US they don’t allow any critical questions about what their great country has been fighting for ages. They prefer to put the blame on the outside world, that is Islamic fundamentalism, coward Europeans, or a stagnating Japanese economy.
The unsustainable American way of life
I fear that we won’t arrive at a new and reliable sense of direction unless we dare to question – against all political correctness – the viability of the US model of economic growth or, what is usually called the American way of life.
In doing so, we have to focus our attention on the topic of our conference, environment and development. Let me submit that the American way of life is squarely unsustainable.
Of course, our friends from America don’t see it that way. To them, the USA represent the far end of what is often called the environmental Kusnets curve.
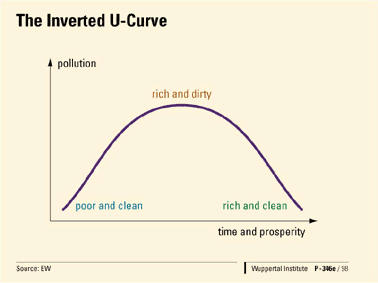
Fig. 7: The inverted U-curve of pollution.
The curve shows the history of the Industrial Revolution. Countries typically start off poor and clean. In the course of industrialisation they become rich and dirty. And finally they become so rich that they can afford expensive pollution control making them rich and clean. Japan, like the USA or Germany, is perfect example of this development. The curve justified in a sense what Indira Gandhi said 30 years ago, namely that “poverty is the biggest polluter”.
The trouble is that the situation of “rich and clean” is not automatically “sustainable”. Facing today’s major environmental problems, we should even call economic wealth the biggest polluter, although this time pollution is not perhaps the right term for the environmental damages. Fig 8 sums it up:
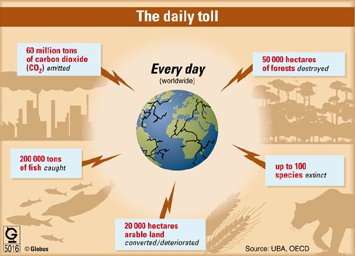
Fig. 8: The daily toll of environmental destruction.
Here we see the daily toll of global environmental destruction. We seem to be losing up to 100 animal or plant species every day. We blow 60 million tons of carbon dioxide into the air, thus changing the atmosphere. Over-fishing and deforestation go on almost unmitigated. Much of the damages stem from excessive land-use, material turnovers and energy consumption in the rich and clean countries. The USA is clearly leading this unsustainable direction of development.
Greenhouse effect and other ecological troubles
In assessing the problems and opportunities let me concentrate on the greenhouse effect, but I assure you that the assessment of land use and of material turnovers would lead to very similar considerations.
Carbon dioxide concentrations are on the rise since the early days of industrialisation. The next picture shows the trend for the last couple of decades:
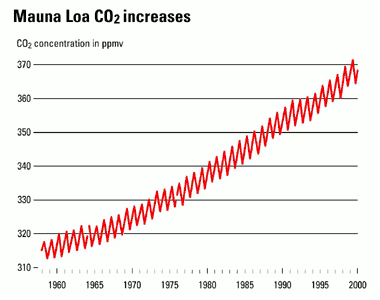
Fig. 9: The steady increase of CO2 concentrations.
The trouble comes when you look at the correlation between CO2 concentrations and global temperatures.
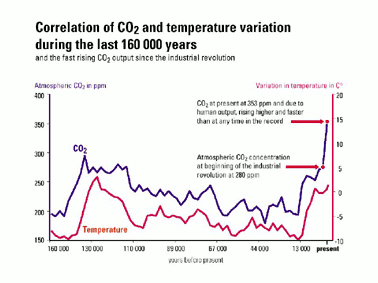
Fig. 10: The “Vostok” expedition found a close correlation between CO2-concentrations and atmospheric temperatures during the last 160.000 years.
We can also see that in the industrial age the blue curve of CO2 is mounting steeply upward. Climatologists expect temperatures to rise correspondingly, and we are already seeing it happen. Nearly each year during the last 15 years has been the hottest year since scientific weather recordings started. During the last 4 years alone we have had twelve or more gigantic natural disasters due to weather in various places on earth including Asia and Europe.
In 2001, the Intergovernmental Panel on Climate Change projected a dramatic increase of global temperatures to occur until the end of this century.
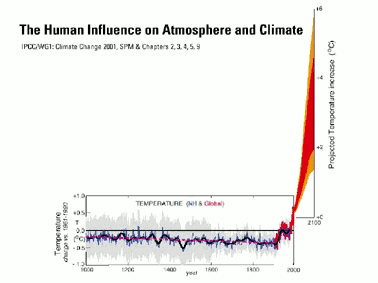
Fig. 11: IPCC’s projection of temperatures until 2100.
Massive changes in the face of the planet could result. Temperatures alone and a few local disasters might not by themselves be the core of the drama. A hotter candidate for the core of the problem is the sea water table (Fig. 12).
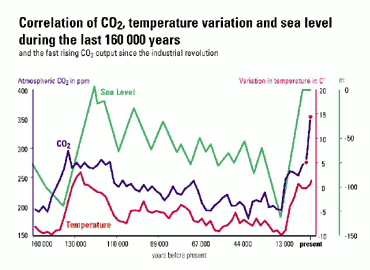
Fig. 12: The sea water table goes with atmospheric temperatures.
In this picture I have added as a green line the sea water table during the last 160.000 years. I invite you to have a look at the difference between a high and low sea-levels. It is more than 100 metres! This formidable variance has a major impact on the coast lines, as can be seen on the next slide:
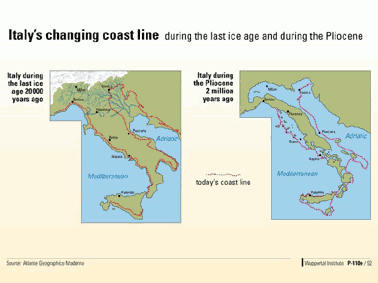
Fig. 13: Italian coast lines during the last Ice Age and during the Pliocene.
This is Italy some 20.000 years ago, during the last Ice Age. But now look at the coast line some 2 million years ago, during a truly hot age. Imagine, ladies and gentlemen, what this picture would mean for the Tokyo and Kansai areas or for Bangladesh, the Netherlands or for Egypt. What may cause more anxiety still is the potential dynamics of change.
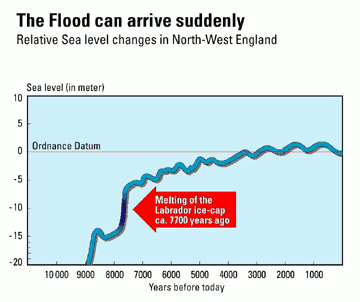
Fig. 14: The collapse, 7700 years ago, of the ice shield covering Labrador and the Hudson Bay.
Studying the British coast line and flood marks left at the rocks rising from the sea, Professor Michael Tooley found that about 7,700 years ago global sea-levels must have risen by 7-8 metres within a few decades or even within a few weeks. His explanation is that the ice shield then covering Labrador and the Hudson Bay were breaking off into the sea within a short period of time. I assume that this was the historical backdrop for the Atlantis and the Biblical Deluge sagas.
If we now go on heating up the atmosphere, major parts of the Antarctic or of Greenland can break off at some unpredictable moment during the next 200 years.
If we want to avoid such disasters, we would be well advised at least to stabilise CO2-concentrations. In order to achieve that, we would have to reduce annual emissions by 60%-80%, according to the Intergovernmental Panel on Climate Change. Let us say – optimistically – that we need only a 50% reduction. This is as far higher ambition than laid down in the Kyoto Protocol. However, halving CO2-emissions may be extremely difficult to achieve because energy experts tell us that we shall rather incur a doubling of CO2 concentrations within a few decades.
Fig. 15: CO2-emissions should be halved to achieve stabilisation of CO2-concentrations, but energy demand is more than doubling.
The reason is that developing countries so far have much lower CO2-emissions per capita than the rich countries. China, Brazil and Ethiopia have every reason now to do exactly what we have demonstrated to them as the core of our industrial success story, namely high energy consumption accompanied by high CO2 emissions.
Factor Four
A gap is opening before us which is at least as large as a factor of four.
Some people both in Japan and Germany believe that the gap can be closed using nuclear power. Without going into any detail of this controversial issue let me only say that after 11th September 2001, safety assessments of nuclear installations have to be re-written from the scratch — with an essentially uncertain outcome. Nikkei President Tsuruta was kind enough to ask me how Germany was handling its decision of phasing out nuclear power while still subscribing to the Kyoto Protocol. One part of the answer is renewable sources of energy. However, we have to admit that there are also limits lying in their costs and in their modest energy densities.
The best solution, I suggest, is a strategy of systematically increasing energy productivity. The textbook for this has the title “Factor Four: Doubling Wealth, Halving Resource Use” which I co-authored with my American friend Amory Lovins and his wife Hunter Lovins.

Fig. 16: Factor Four: translated into many languages.
The book heralds a new industrial revolution. It thereby also conveys a new sense of direction for technological progress. It may encourage investors to go for new investments and for new technologies.
Quadrupling resource productivity, eventually even increasing it by a factor of ten, as my friend Friedrich Schmidt-Bleek is suggesting, is a gigantic challenge requiring the commitment of the brightest engineers and the boldest business people. It is my sincere hope that both Japan and Germany will play major roles in bringing that new technological revolution about.
Let me make the analogy to the industrial revolution more explicit. During the first fifty or seventy years of the industrial revolution, the world has seen a fourfold increase of labour productivity. Later, labour productivity increases even accelerated, owing to better technological communication and ever increasing costs of human labour.
Today, albeit expensive, labour is no longer a scarce factor. According to statistics of the International Labour Organisation (ILO), over 800 million people are unemployed or have only access to marginal work. In this day and age, it somehow doesn’t make much sense for the world economy to go on and maximise robotics and other labour saving technologies while neglecting productivity of the really scarce factor of our days, natural resources.
The mentioned book, Factor Four, which also was translated into Japanese, features 50 examples showing the potential of improving resource productivity at least by a factor of four. Twenty examples relate to energy productivity, twenty to solid material productivity, and ten to the transport sector.
Let me briefly introduce you to the new universe of factor four technologies. For this I shall show you some pictures beginning with Amory Lovins’ present favourite example, “Hypercar”:
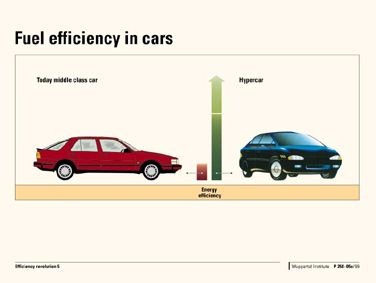
Fig. 17: Hypercar is four times more fuel efficient than normal automobiles.
Hypercar, seen on the right hand side, is designed to use only one-and-a-half litres per hundred kilometres. I won’t go into technical details of this ultra-light vehicle.
The second example is what we refer to as the “passive house” which in Germany’s cold climate needs hardly any external heating except for some passive solar energy.
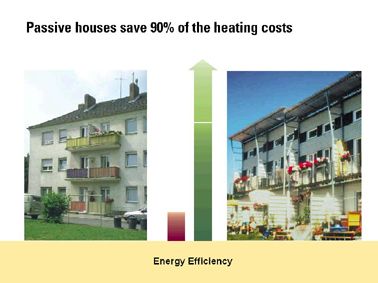
Fig. 18: Passive house, a concept to save 90% of the typical heating costs.
It is very well insulated. It needs no radiators and thus saves space and money making it commercially competitive with ordinary constructions. It is not only insulation and energy management that counts. Nearly equally important is the materials of construction. Wood is among the best, of course, in particular if we consider the carbon balance.
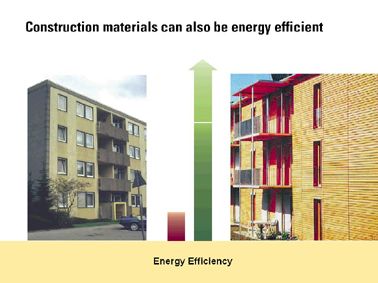
Fig. 19: Wooden construction saves energy and CO2.
Very familiar to you all are light bulbs and their modern efficiency substitutes.
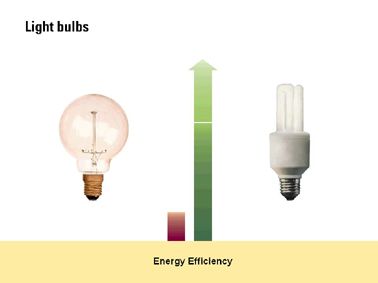
Fig. 20: Fluorescent light bulbs are four times more efficient than incandescent bulbs.
A more recent development is light diodes which are still a factor of two better than fluorescent lamps.
Lets us now turn to household appliances. When you replace your free-standing refrigerator with a cold-storage room built into the north wall of the house, you can also save approximately a factor of four both in terms of energy and materials.
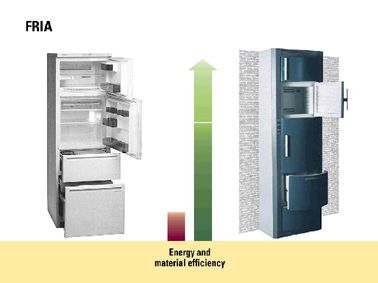
Fig. 21: FRIA, the non-mobile refrigerator.
In tropical countries, but also during the summer in Japan, the biggest energy eater in office and apartment buildings is air-conditioning. In Singapore, we found an engineer, Mr Lee Eng Lock, who builds air-conditioning systems that need some 70% less power than conventional ones. Imagine the savings for office towers and tourist hotels all around the hot belt of this planet.
When you replace an old filing cabinet with a CD-ROM system, you have a Factor 10 or more in material and resource productivity and you have much swifter access to your data.
Water is now one of the scarcest resources in the world. Several examples in our book deal with factor four water efficiency in agriculture, industry and households.
One important industry for water consumption is textiles. We found a small German manufacturer, Hess Natur, advertising clothes that overall need roughly one quarter of the natural resources including fresh water needed in ordinary products.
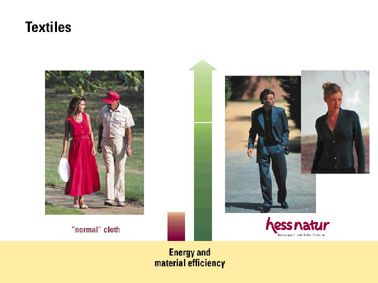
Fig. 22: Textiles with a cradle-to-grave resource use four times lower than average.
Another strategy of saving materials and energy is improving mechanical properties of such simple materials as steel. I recently learned about exciting advances in the Japanese steel industry.
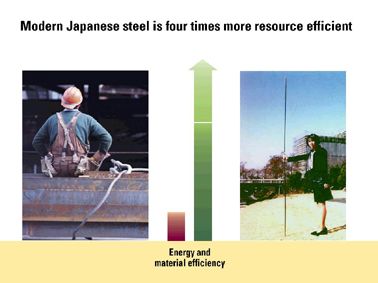
Fig. 23: Innovative steel from Japan.
Instead of being a clumsy and heavy material, this extraordinary steel rod is incredibly light and elegant and yet extremely robust.
Let me finally turn to food. When you eat tomatoes from the Netherlands during the winter season, it could be that around 100 Kcal have been invested so that you can afterwards eat a Kcal tomato. In the case of European intensive husbandry beef each Kcal of beef requires some 20 Kcal of extended energy inputs. Ocean fishing, I am sorry to say, isn’t much better. With a diet, which is a little more seasonal, containing somewhat less meat and fish and stemming from organic farming or aquaculture you can easily save a Factor 4 in energy consumption, as the next picture indicates:
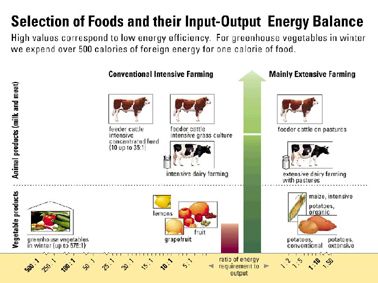
Fig. 24: Food can “eat” a lot of energy — but need not.
Stefanie Böge of the Wuppertal Institute has looked into the transport intensity involved in the production of strawberry yoghurt in Germany.
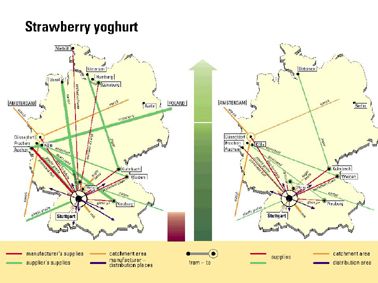
Fig. 25: 8.000 kilometres for strawberry yoghurt? It is too much!
She found that lorries are criss-crossing Europe at a total of around 8,000 km for the production of a cup of strawberry yoghurt. Clearly, this is not necessary.
Not only yoghurt journeys can be rationalised. Many business trips can be saved using videoconferences. And letters and manuscripts don’t always need airmail from Japan to Europe. Much can be sent by e-mail, saving a factor of 100 or 1000 in resource use. I am fully aware that substituting electronic dispatch for air transport in the case of tourism and Business Leaders Conferences is not quite so simple. Besides, people like to visit Tokyo for sight-seeing. However, in each case it is worth reflecting if a trip is really necessary.
In many cases the magical factor of four is not attained in one go. German chemical industry for instance managed to increase its overall energy productivity by a factor of four during a period of thirty years. Hundreds if not thousands of little inventions and process improvements were instrumental in bringing this success story about. You may not get much acclaim for this complex and incremental factor four story. But the effect is all the same.
Making it profitable
After having sketched out the shape of the new universe of factor four technologies I should like to turn to some economic and political questions. What can we do to make this technology shift profitable? Fortunately a reasonably large part of the eco-efficiency measures are already profitable. This is particularly true in developing countries. At my last journey to China, I read a brochure from a German consultancy working on strategies to reduce CO2 in China. And this is what they found:
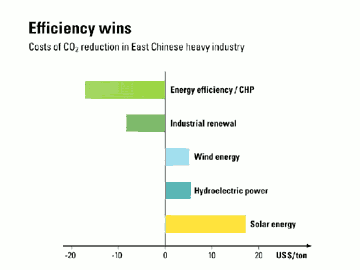
Fig. 26: Fichtner found that CO2 reduction can be done at a profit in China.
I was actually surprised to see how cheap it was to reduce CO2 using wind or solar energy. But the real surprise was that just industrial modernisation would produce CO2 reductions as a windfall product. Best of all, strategic energy efficiency will earn the investor twenty dollars per ton of CO2 avoided. This is surely the basis for the astonishing fact that according to official statistics, China has reduced it CO2-emissions during the last three consecutive years while maintaining an impressive economic growth of up to 7% per annum.
Even if not every step of efficiency gains is profitable, the general attitude of eco-efficiency seems to pay. A Swiss-American partnership had lead to the establishment of the Dow Jones Sustainability Index representing the top firms worldwide which have a successful policy of improving eco-efficiency. Look how that paid off on the unforgiving international stock markets. The Sustainability Index had actually a better performance than the benchmark Dow Jones Index:
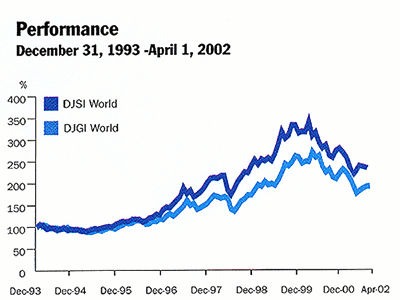
Fig. 27: Dow Jones Sustainability Index beats the ordinary Dow Jones.
Is that not a very encouraging piece of news? Unfortunately, the scope for profitable eco-efficiency is still rather limited. If we aim at a factor of four, we have to alter the frame conditions so as to make strategic efficiency increases still more profitable.
It can be seen as a perfectly legitimate objective for the state and for the international community to create an atmosphere that is favourable for creating the new industrial revolution. The basic idea is to make resource rationalisation more profitable than labour rationalisation. This has been the philosophy behind the ecological tax reform which has been introduced in most European countries, including Germany. The ideal scenario is one in which prices for energy, water and raw materials increase slowly (e.g. by 3 – 4% annually) so that technical progress can approximately keep pace. Imagine petrol prices increasing by 4% every year and the car fleet becoming 3% – 4% more efficient every year until. Then the fuel price per kilometre will remain almost stable. And your country would have to import much less oil.
Many other measures can be conceived to make resource productivity more profitable. Eco-audits have become very popular in Germany, Japan and elsewhere. The Netherlands through their former government have introduced a rule that pension benefits are tax free as long as the benefits are coming from certified stock portfolios of ecologically committed firms.
In the end I believe that one of the most important driving forces of technological progress is a new vision of how technology could look like in the future. I hope I was able in a very humble way to contribute to this goal.
Back to the alleged Japanese crisis
Let me return to the considerations made at the beginning. The eco-efficiency revolution can theoretically serve as a guideline for Japanese and European industry to return to investment optimism. In this field, it is both responsible and reasonable to go for innovations and massive investments that can shape the technological face of the world.
I also suggest to strengthen the advocates of the public sector again. The weakness of the state is likely to remain. But new allies have appeared on the scene to help the state defend public goods including the environment. It is the civil society NGOs. My last picture shows you in the former caricature form how I see the re-balancing of powers between private goods and public interest.
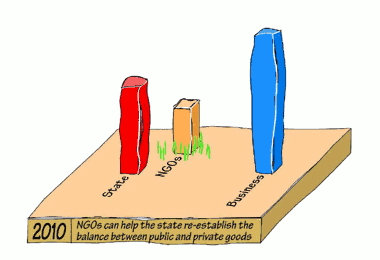
Fig. 28: NGOs can help the state re-establish the balance between public and private goods.
Let us hope that enlightened business leaders join in re-establishing both that said balance and the optimism that may also help overcome the economic stagnation some of you feel as a heavy burden on your companies and on your country.